Hi,
This sounds like an issue with defragmentation on your database as I expect that there is no SQL maintenance being done on the database, which explains the degradation over time. Octopus are generally hygienic creatures, cleaning up after themselves, but unfortunately, they know little about database defragmentation.
We have some useful resources you can use to help you implement database maintenance http://g.octopushq.com/SQLServerMaintenanceGuide, and I’m personally a big fan of Ola Hallengrens approach which you can read about on https://ola.hallengren.com/. One table to pay the most attention is the events table as this tends to be the busiest table in Octopus as this is where a lot of our data is stored and it changes the most.
The first thing to do is to check if this is the case, and you can do this by selecting the database, right-click, Reports -> Standard Reports and then selecting Index Physical Statistics.
The output will look something like the below, and you may have recommendations for Operations Recommended, which include Reorganize and Rebuild.
You should be able to drill into each table and see the levels of defragmentation. I generally advise having it under 40%, but the lower, the better as this will impact your day to day usage with Octopus.
At this point, you will want to set up some maintenance plans for your Octopus database, and I will take you through how to do this manually in SQL Management Studio.
Using the Maintenance Plan Wizard
I’m a big fan of using the SQL Maintenance Plan Wizard as it’s very straight forward, and when you get more advanced, you can use the Plan option, as it gives you a great degree of flexibility and if you’re comfortable with that approach, most of the below will still help with the configuration.
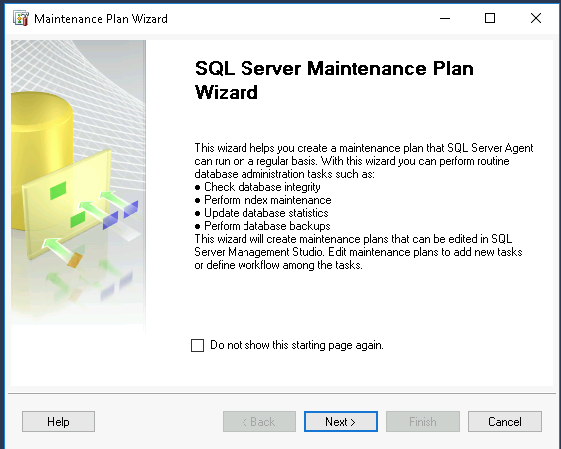
Select Maintenance Plan -> Right Click -> Select Maintenance Plan Wizard

Select Next when the pop-up window appears
I like naming things what they are doing, and in this instance, name the Plan accordingly. You will have options for “Separate schedules for each task” and running them all at the same time. I like having the granular control of each job running at a set time rather than one after each other. The reason for this is that I can also run them ad-hoc if required as sometimes you will want to update statistics, and you can do that under the SQL Server Agent. If a single schedule works for you, then it’s a good option.

Next, you will have options to select on the type of Maintenance tasks. I recommend:
- Check Database Integrity
- Reorganize Index
- Rebuild Index
- Update Statistics
You can also use these for Database backups and cleanups,etc… but that’s out of scope for this.
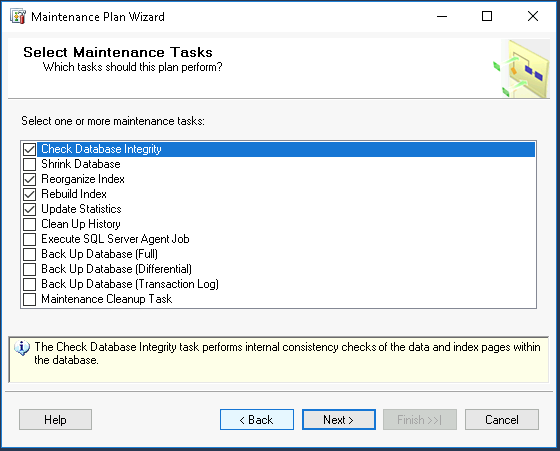
Select Next

Select your Octopus Database from the drop down, and set your schedule. Generally recommend daily particularly if you’re experiencing slowness currently as it may take a few runs to get it working to a better standard. Weekly also works and you may want to speak to a DBA in your team.

This is what each of the Schedule windows looks like, and I’ve specified Daily at 1 am. I’ll skip over this section in each of the next steps.
Select your Octopus Database from the dropdown, ensure Tables and views are selected. I’m a fan of selecting the Optimize index if fragmentation is above 10%. This will likely mean it always runs. Set your schedule and select Next.
Select your Octopus DB, and ensure you have Tables and Views selected. Set your defragmentation under 30% but again would consider as low as 10%, so it’s as optimized as possible. Set your schedule and select next.
Updating Statistics step is straight forward, and you need to select your database and ensure it’s set to all existing statistics and Full Scan. Set your schedule, preferably at the end of the other tasks, so you have fresh statistics to work with.
Select a location for the log files to write out too.

At this point, you’re almost complete, and you can select Finish.
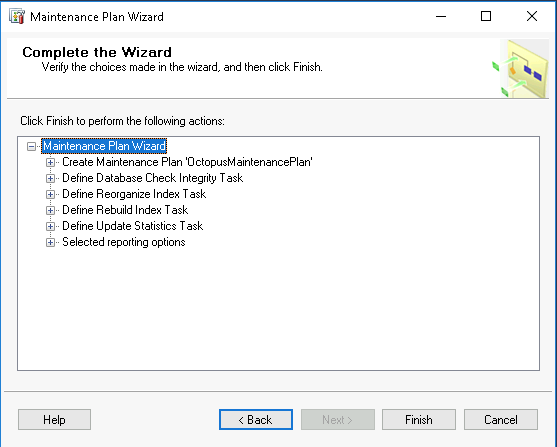
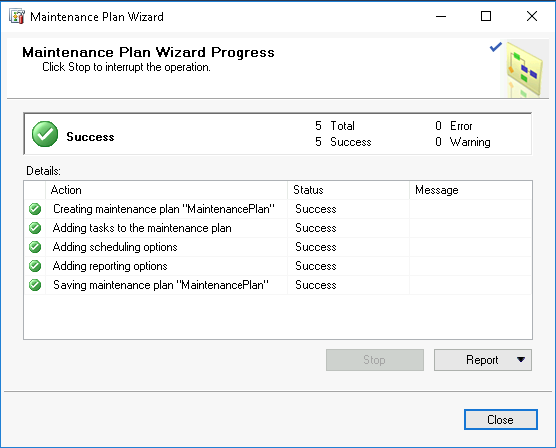
That’s you done as long as everything looks good.
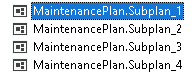
At this point, you can see the 4 jobs listed under SQL Server Agent -> Jobs as below.
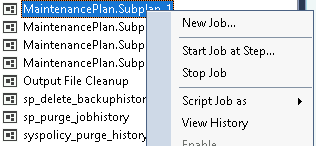
You can then run each of these steps ad-hoc as required if you want to do emergency maintenance by right-clicking on the job and then select “Start Job at Step”
After a few runs, your database should be optimized and you should see a significant improvement in your database performance and defragmentation should be lower.


